Component 2 of 3 · the proven engine

F&B & Retail Boulevard

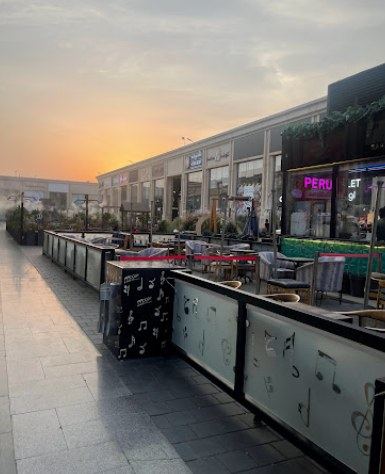
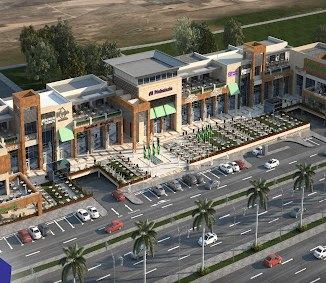
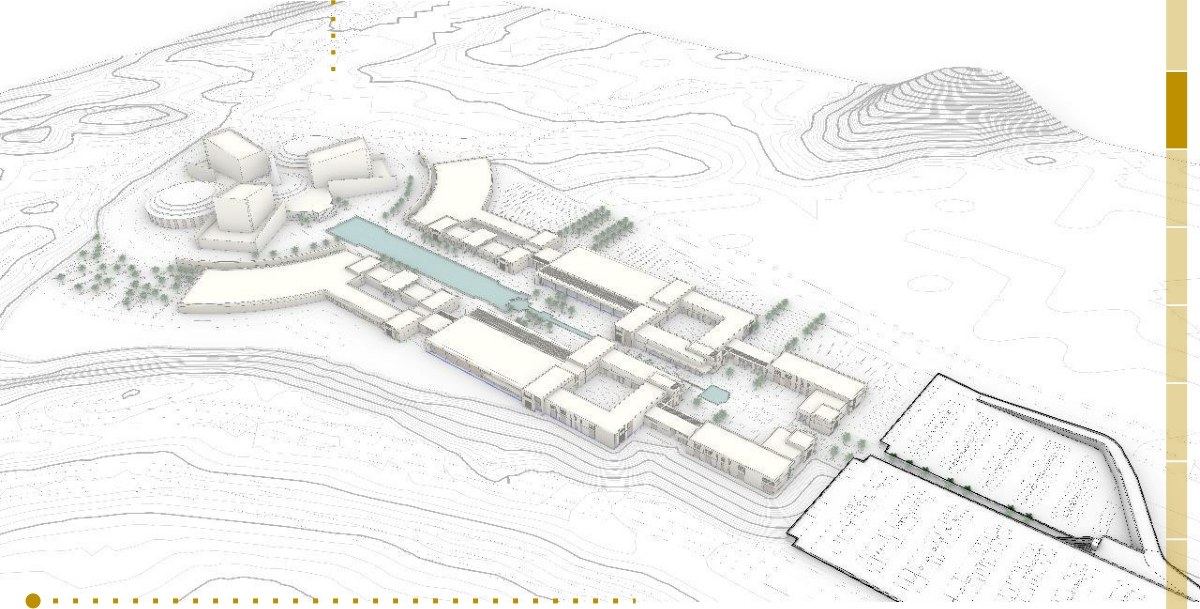
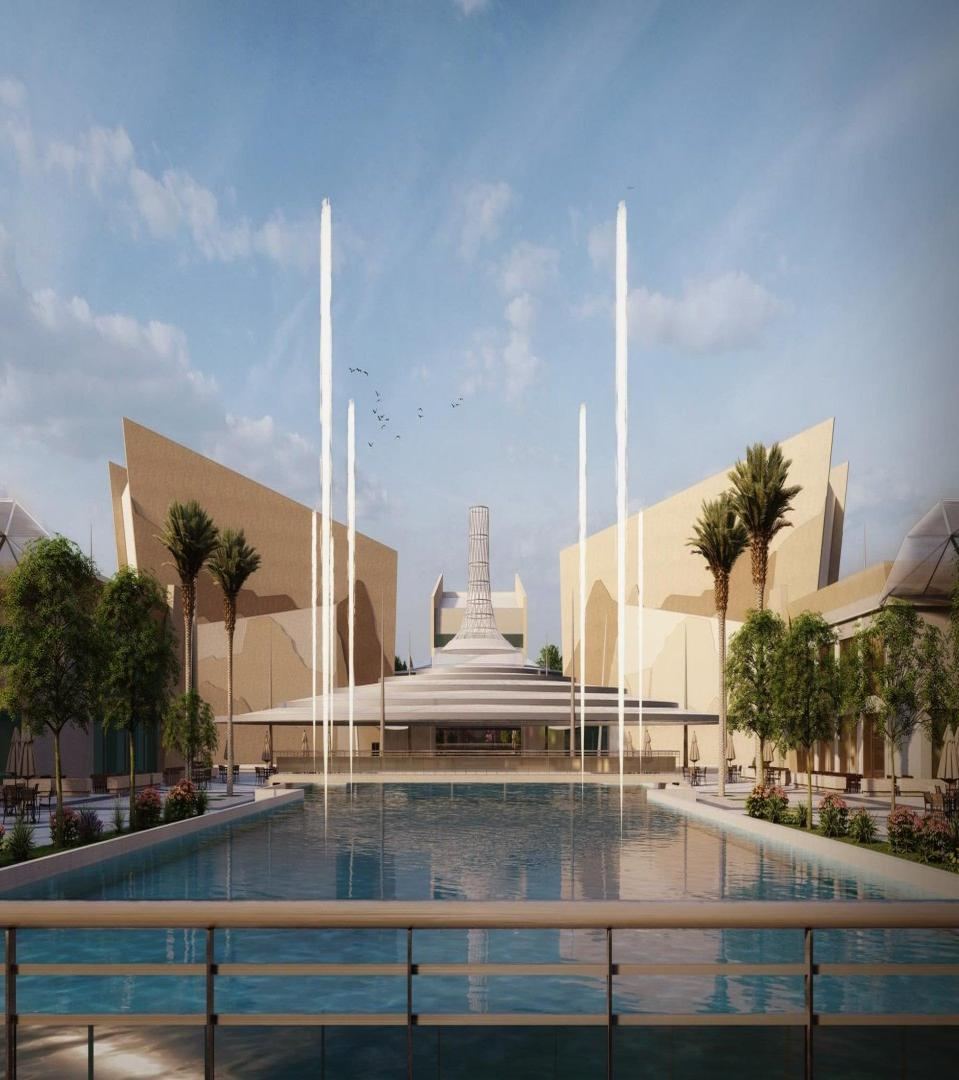
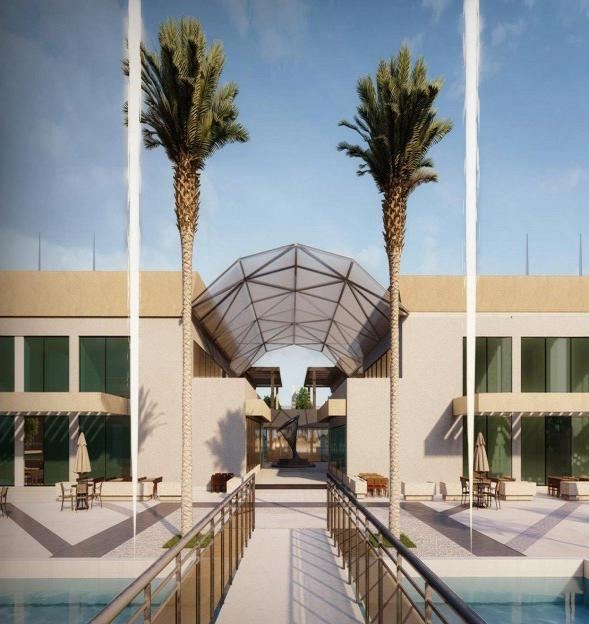
38,597 sqm of open-air dining, cafés and specialty retail along a ceremonial water axis from the plaza to the Experience Centre. Phase 1 opens Savills' tenant mix (July 2024) in Savills' proportions on 38,597 sqm; expansion to Savills' recommended 48,467 sqm (53,987 sqm with mezzanine) is a later retail phase taken as demand grows. Revenue is Savills' pro-forma scaled to the Phase 1 GLA — every income line, not only rents.

Overview › F&B & Retail Boulevard
Key revenue drivers

What drives the numbers

38,597sqm net GLA in Phase 1 — 71.5% of Savills' 53,987 sqm
SAR 1,652Revenue per occupied sqm, 2031 — all income lines ÷ (GLA × 92%); SAR 1,520 per sqm of total GLA; unit rent alone ≈ SAR 979
50 → 70 → 92%Leasing occupancy ramp (Savills)
+10% / 3 yrsRent step-ups from 2031
SAR 59MRevenue in year 3 (2031): units 34.8 · specialty 4.3 · service charge 5.2 · marketing 1.7 · sponsorship 6.4 · media 6.2
79%EBITDA margin after common-area costs and marketing
SAR 1,102Average indoor rent per sqm per year across the mix (Savills; SAR 300–1,900 by function)
SAR 19.8MLandlord fit-out contributions funded by the project (50% of Savills' 39.7)
Financials on a timeline

Exhibit: Retail Boulevard Returns — key assumptions, operations, capex and returns

Download this exhibit as PDF ↗   Excel model ↗

Exhibit: Retail Boulevard ReturnsTotalYear 1
2026
Year 2
2027
Year 3
2028
Year 4
2029
Year 5
2030
Year 6
2031
Year 7
2032
Year 8
2033
Year 9
2034
Year 10
2035
Year 11
2036
Year 12
2037
Year 13
2038
Year 14
2039
Year 15
2040
Key assumptions
Net GLA, sqm — Phase 1 (Savills recommended 53,987 sqm incl. mezzanine is a later phase)––38,59738,59738,59738,59738,59738,59738,59738,59738,59738,59738,59738,59738,597
Leasing occupancy (Savills ramp)––50.0%50.0%70.0%92.0%92.0%92.0%92.0%92.0%92.0%92.0%92.0%92.0%92.0%
Revenue per sqm of total GLA, SAR/yr (all income lines)––9579571,2491,5201,5201,5201,6721,6721,6721,8391,8391,8392,023
Revenue per occupied sqm, SAR/yr (÷ GLA × occupancy; unit rent alone ≈ SAR 979 at stabilisation)––1,914.11,914.11,783.81,652.21,652.21,652.21,817.41,817.41,817.41,999.21,999.21,999.22,199.1
Rent step-up every 3 years from 2031––10.0%10.0%10.0%10.0%10.0%10.0%10.0%10.0%10.0%10.0%10.0%10.0%10.0%
Common-area costs, SAR'000––4,7329,7009,94210,19110,44610,70710,97511,24911,53011,81912,11412,41712,727
Operations
Retail: Rental income — units (base rent + revenue share)447,361––5,43921,75728,62434,77034,77034,77038,24738,24738,24742,07142,07142,07146,278
Retail: Rental income — specialty leasing56,537––8853,5393,8934,2824,2824,2824,7104,7104,7105,1815,1815,1815,699
Retail: Service charge income67,104––8163,2644,2945,2155,2155,2155,7375,7375,7376,3116,3116,3116,942
Retail: Marketing income22,368––2721,0881,4311,7381,7381,7381,9121,9121,9122,1042,1042,1042,314
Retail: Sponsorship79,428––5362,1454,2906,4346,4346,4347,0787,0787,0787,7867,7867,7868,564
Retail: Media sales income82,236––1,2875,1485,6626,2286,2286,2286,8516,8516,8517,5367,5367,5368,290
Revenue755,034––9,23536,93948,19458,66958,66958,66964,53564,53564,53570,98970,98970,98978,088
EBITDA | Retail (after operator fees)592,853––4,21426,08336,74346,64146,38646,12551,54151,26650,98556,94856,65356,35062,916
Koushan Asset Management Fee––––––––––––––––
Land Lease (revenue share)(15,101)––(185)(739)(964)(1,173)(1,173)(1,173)(1,291)(1,291)(1,291)(1,420)(1,420)(1,420)(1,562)
Land Lease Cost (allocated)(9,688)––(570)(760)(760)(760)(760)(760)(760)(760)(760)(760)(760)(760)(760)
SPV overheads (allocated)(53,540)––(1,828)(3,748)(3,842)(3,938)(4,037)(4,138)(4,241)(4,347)(4,456)(4,567)(4,681)(4,798)(4,918)
Component NOI514,524––1,63120,83631,17740,77040,41640,05445,24944,86944,47950,20249,79249,37255,677
Capex
Structural works48,84111,27137,570–––––––––––––
Finishes45,084–24,83420,250––––––––––––
MEP works31,851–20,11211,739––––––––––––
Landscaping, water features & infrastructure29,6221,22914,37914,015––––––––––––
FF&E / content (n/a)––––––––––––––––
Contingency & project management reserves6,8259564,2771,593––––––––––––
Design, supervision, fees & permits12,7408,0543,6401,047––––––––––––
Marketing, rent & administration during construction5,4604101,3653,686––––––––––––
Pre-opening (within the SAR 550M cap)19,830––9,9159,915–––––––––––
Total CapEx200,25321,918106,17662,2449,915–––––––––––
Net Cash314,271(21,918)(106,176)(60,613)10,92131,17740,77040,41640,05445,24944,86944,47950,20249,79249,37255,677
Exit Value at exhibit cap (final year, leasehold-adjusted)530,733––––––––––––––530,733
Net Cashflows including TV845,005(21,918)(106,176)(60,613)10,92131,17740,77040,41640,05445,24944,86944,47950,20249,79249,372586,410
Retail IRR19.9%

SAR'000 unless stated. Years 1–15 = 2026–2040; exit in Year 15 (2040) at a 10% cap rate adjusted for the leasehold to 2074; before zakat and VAT recovery. Total investment capped at SAR 550M including pre-opening; shared budget items allocated by built-up area; fixed land rent and SPV overheads (which cover the asset-management role — no separate Koushan fee) shared between the Experience Centre and retail in proportion to stabilised 2032 revenue, none to the hotel; hotel is Phase 2 (construction from 2027 after the construction permit and Al-Maqr approval). Source: Mayadeen Park Financing Model v1.0 (22 Oct 2026).

18.5%Component IRR, hold to 2074
19.9%Component IRR, exit 2040 at 10% cap
20.2%Yield on allocated capex, 2032
SAR 200MAllocated capex incl. pre-opening
2034Payback year
Budget

Hard and soft cost within the SAR 550M cap — Retail column highlighted

SAR millionGMP budgetRetailExperience CentreHotel (Phase 2)Total within capPre-opening offset
Structural works130.048.812.648.8110.2(19.8)
Finishes120.045.111.645.1101.7(18.3)
MEP works70.031.911.926.370.0—
Landscaping, water features & infrastructure65.129.611.024.465.1—
Hotel FF&E (net of pre-opening)50.0——35.035.0(15.0)
Experience Centre content & AV systems60.0—60.0—60.0—
Contingency reserve11.05.01.94.111.0—
Project management reserve4.01.80.71.54.0—
Design15.06.82.55.615.0—
Supervision8.03.61.43.08.0—
Fees & permits5.02.30.81.95.0—
Marketing & pre-opening (within GMP)7.03.21.22.67.0—
Rent & administration during construction5.02.30.81.95.0—
Hard cost (construction)510.1162.2109.6185.2457.1(53.0)
Soft cost40.018.26.815.040.0—
Pre-opening (added within the cap)—19.818.215.053.053.0
TOTAL INVESTMENT550.1200.3134.6215.3550.1—

The contractor's GMP breakdown (510 construction + 40 soft) with all pre-opening absorbed inside the SAR 550M cap: hotel pre-opening (15) comes out of the FF&E & preparation line (FF&E 35); Centre (18.2) and retail (19.8) pre-opening are offset pro-rata against structural works and finishes. Shared items allocated by built-up area; direct items to their component.

Tenant mix & revenue components

Savills' tenant mix, scaled from 53,987 sqm to the 38,597 sqm Phase 1

Savills recommended 48,467 sqm of units, outdoor areas, terraces and storage plus an optional 5,300 sqm mezzanine (53,987 sqm in total) and priced every function. Phase 1 opens 38,597 sqm. The business case keeps Savills' mix in the same proportions and scales every income line — unit rents, specialty leasing, service charge, marketing, sponsorship and media — by 38,597 ÷ 53,987. The remaining area is a later retail phase, to be added as demand grows until the boulevard reaches Savills' recommended size; it is not in the base case and would add c. 40% to the retail revenue lines at the same rates.

Function (Savills tenant mix, Jul 2024)Savills GLA, sqmSharePhase 1 GLA, sqmIndoor rent, SAR/sqm/yrPotential rent at Savills GLA, SAR MPotential rent at Phase 1 GLA, SAR M
All day dining12,85423.8%9,1901,20015.4211.03
Food Hall5,50210.2%3,9341,8009.907.08
Specialty Food4,4988.3%3,2161,4006.304.50
Fine Dining3,9507.3%2,8241,1004.343.11
Arts & Culture3,3906.3%2,4245001.701.21
Fashion Retail3,0565.7%2,1859002.751.97
Coffee Shop2,3164.3%1,6561,4003.242.32
Coffee Shop & Co-Working1,7413.2%1,2451,2002.091.49
Retail Concept Store1,5022.8%1,0746000.900.64
Kids Entertainment1,3072.4%9346000.780.56
Accessories1,1862.2%8481,2001.421.02
Supermarket1,0742.0%7688000.860.61
Farmer's Market (lump-sum rent SAR 150,000/yr)1,0481.9%7491430.150.11
Gift Shop9111.7%6511,9001.731.24
Jewelry8681.6%6211,4001.220.87
Coffee Shop & Breakfast8351.5%5971,4001.170.84
Footwear7961.5%5691,0000.800.57
Cosmetics7151.3%5119000.640.46
IT&C6241.2%4461,2000.750.54
Children Retail5000.9%3579000.450.32
Convenience4490.8%3211,2000.540.39
Pastry Shop2010.4%1441,4000.280.20
Gift Shop & Book Shop1880.3%1341,7000.320.23
Bookshop1300.2%939000.120.08
Nuts & Convenience1250.2%891,6000.200.14
Chocolates & Gifting670.1%481,6000.110.08
Optics650.1%461,0000.070.05
Storage4,0877.6%2,9223001.230.88
Total53,985100%38,5971,102 avg59.542.5

Savills Tenant Mix, 24 July 2024, p.5: indoor estimated rents by function; first-floor units at −30%, outdoor and terraces at 50% of indoor rates, storage at SAR 300; Farmer's Market at a SAR 150,000 lump sum. Potential rent is GLA × indoor rate at 100% occupancy before those adjustments.

Revenue components by year (SAR M)

SAR M — Savills income lines × Phase 1 scale factor (38,597 ÷ 53,987 = 0.715)2028–402028202920302031203220332034203520362037203820392040
Rental income — units (base rent + revenue share)447.45.421.828.634.834.834.838.238.238.242.142.142.146.3
Rental income — specialty leasing56.50.93.53.94.34.34.34.74.74.75.25.25.25.7
Service charge income (15% of base rent)67.10.83.34.35.25.25.25.75.75.76.36.36.36.9
Marketing income (5% of rent)22.40.31.11.41.71.71.71.91.91.92.12.12.12.3
Sponsorship79.40.52.14.36.46.46.47.17.17.17.87.87.88.6
Media sales income82.21.35.15.76.26.26.26.96.96.97.57.57.58.3
Retail revenue755.09.236.948.258.758.758.764.564.564.571.071.071.078.1

Savills pro-forma p.7 (income summary including mezzanine) Years 1–3 at 50% / 70% / 92% occupancy, scaled to the Phase 1 GLA; 2028 soft opening at the Q4 factor; +10% step-up every three years from 2031. Sponsorship and media income scaled with the GLA for prudence.

Reconciliation to the Savills pro-forma (Year 3, stabilised)Value
Savills rental income — units, Year 3 at 92% occupancy (SAR M, 53,987 sqm)48.63
÷ 92% occupancy = gross unit rent at full occupancy (SAR M)52.86
Blended factor vs 100% indoor rates (first floor −30%, outdoor & terraces 50%, step-up)0.89
Phase 1 scale factor (38,597 ÷ 53,987)0.71
Phase 1 unit rent, Year 3 (SAR M) = Savills × scale34.77
Phase 1 total retail revenue, Year 3 incl. service charge, specialty, sponsorship, marketing, media (SAR M)58.67
Revenue per occupied sqm at stabilisation (SAR/yr) — all income lines ÷ (GLA × 92%)1,652.20
Revenue per sqm of total GLA at stabilisation (SAR/yr)1,520.03
Unit rent per occupied sqm at stabilisation (SAR/yr) = average indoor rate × blended factor979.17

How the tenant mix ties to the revenue line

  1. Tenant mix at the Phase 1 GLA, 100% occupancy, Savills indoor rates: 38,597 sqm × SAR 1,102 mix-weighted average = SAR 42.5M (the highlighted "potential rent" total).
  2. × blended factor 0.889: Savills lets first-floor units at −30% and outdoor/terraces at 50% of the indoor rate — their own unit rent at full occupancy is 0.889 × their potential at indoor rates. Gives SAR 37.8M.
  3. × 92% stabilised occupancy = SAR 34.8M — the "Rental income — units" line in 2031. Per occupied sqm that is SAR 979 = 1,102 × 0.889.
  4. + the non-unit lines Savills layered on top — specialty leasing 4.3, service charge 5.2, marketing 1.7, sponsorship 6.4, media 6.2 = SAR 23.9M — = SAR 58.7M, i.e. SAR 1,652 per occupied sqm or SAR 1,520 per sqm of total GLA.

The exhibit rate is per occupied sqm (GLA × occupancy) so it stays comparable with Savills' quoted rents and does not collapse during the 50 / 70 / 92% ramp; the per-total-GLA figure is shown alongside it. The 0.889 factor is derived to tie the mix to Savills' Year 3 (it also absorbs Savills' step-up assumption) — it is not an independent input.
Documents & model

Download