Component 3 of 3 · the largest engine

600-key Hotel

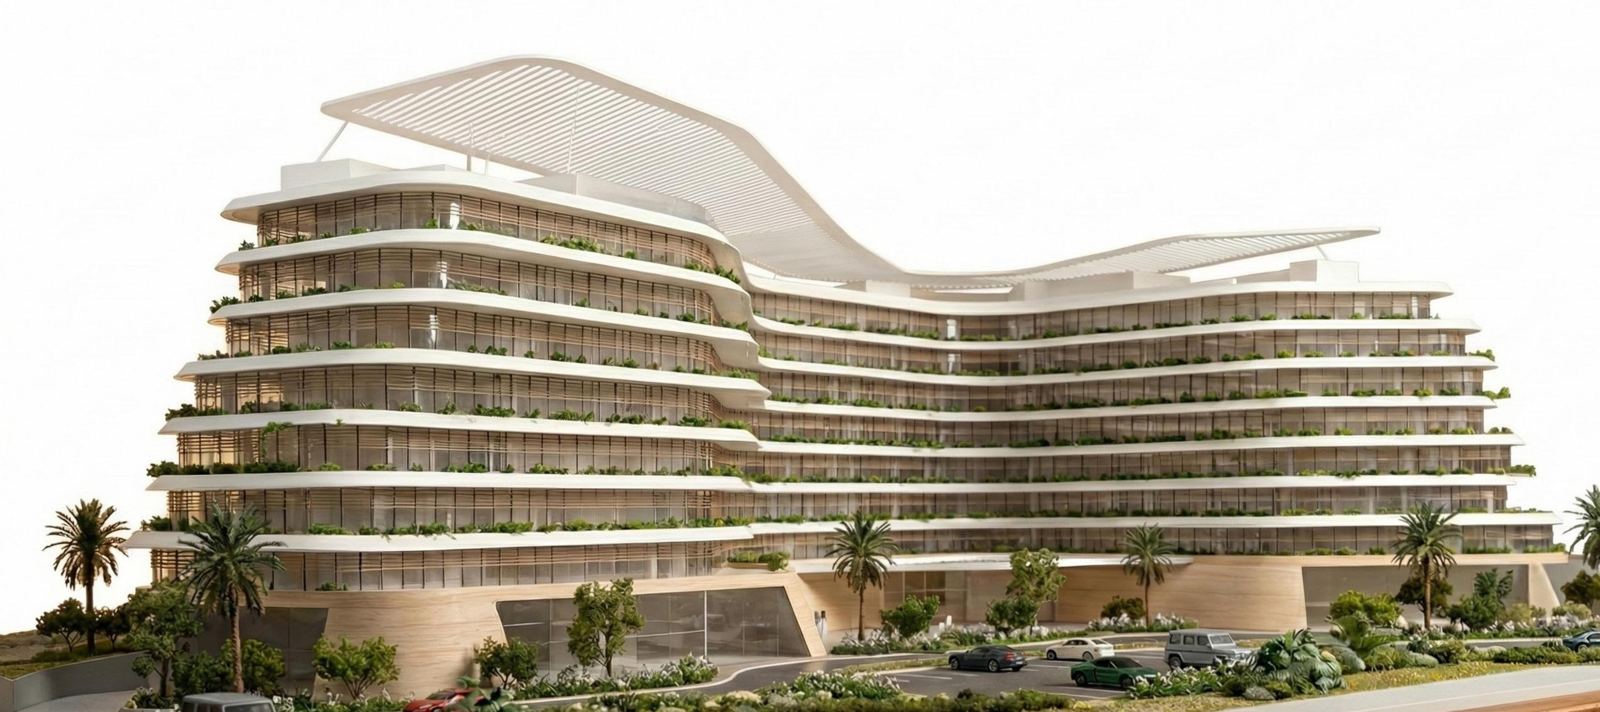
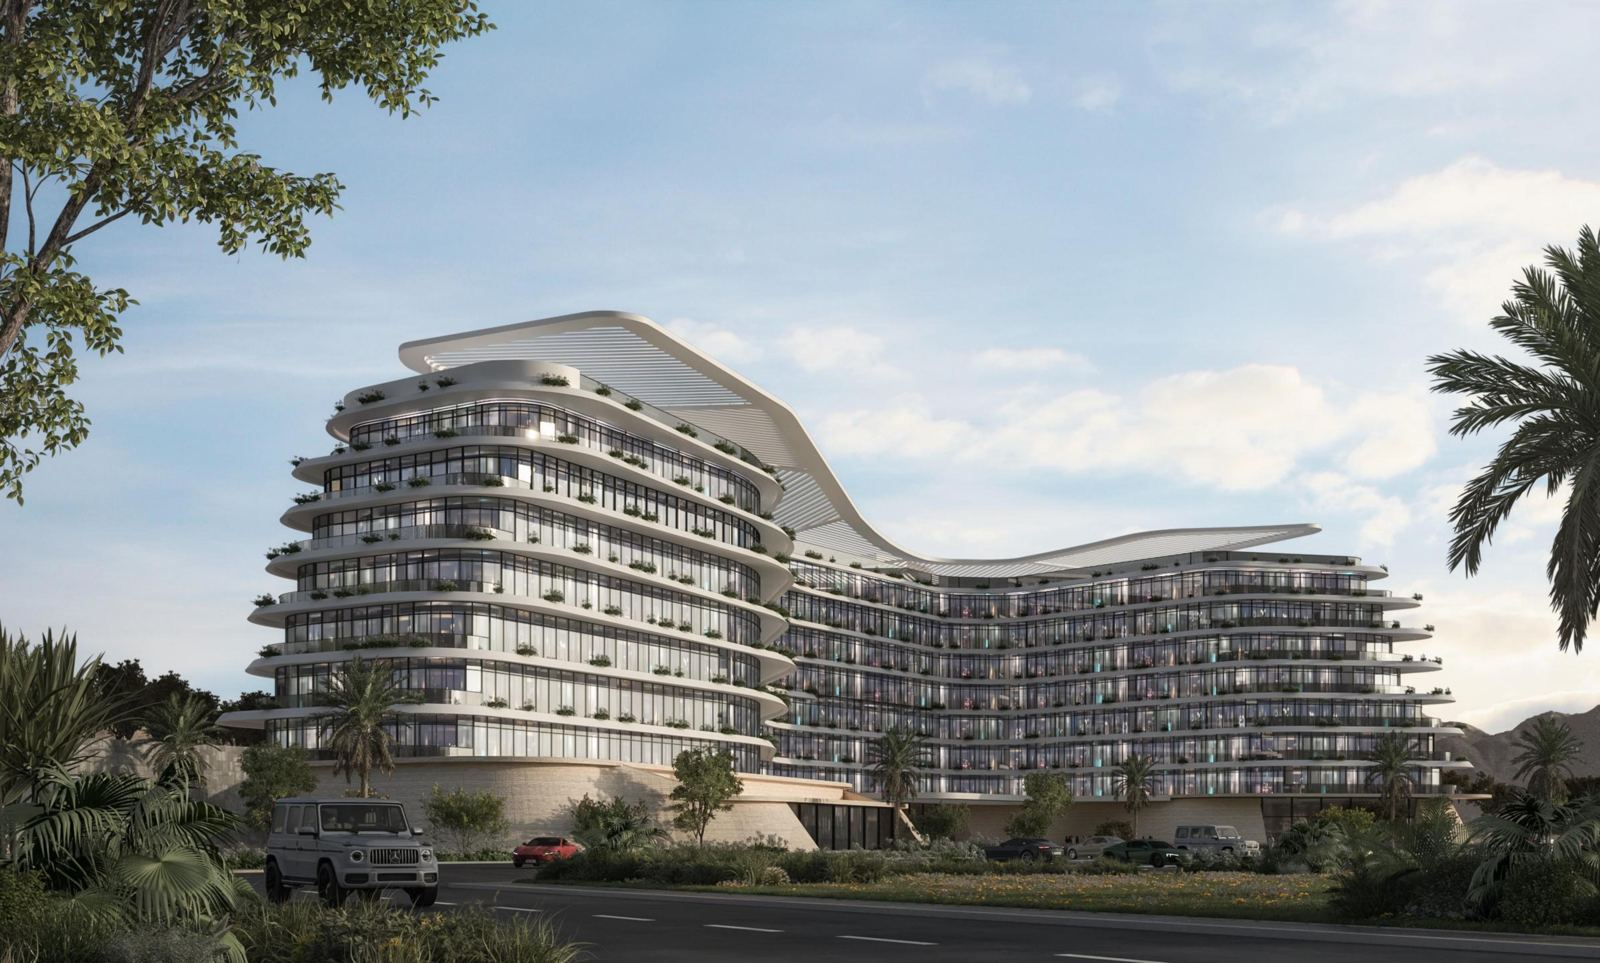
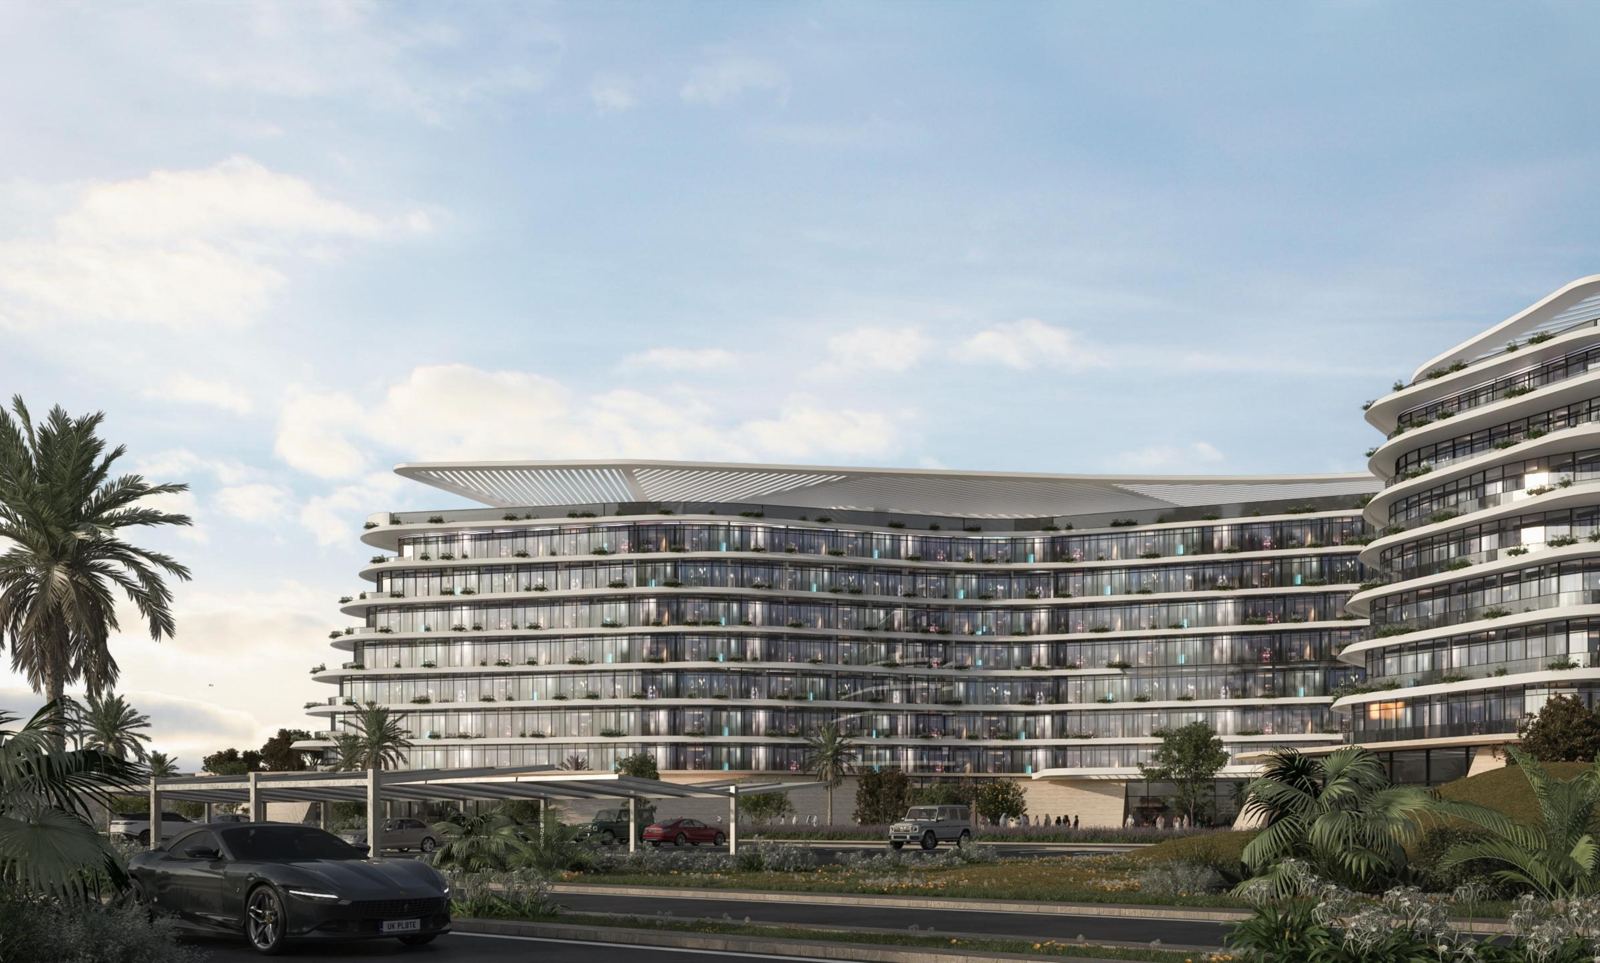
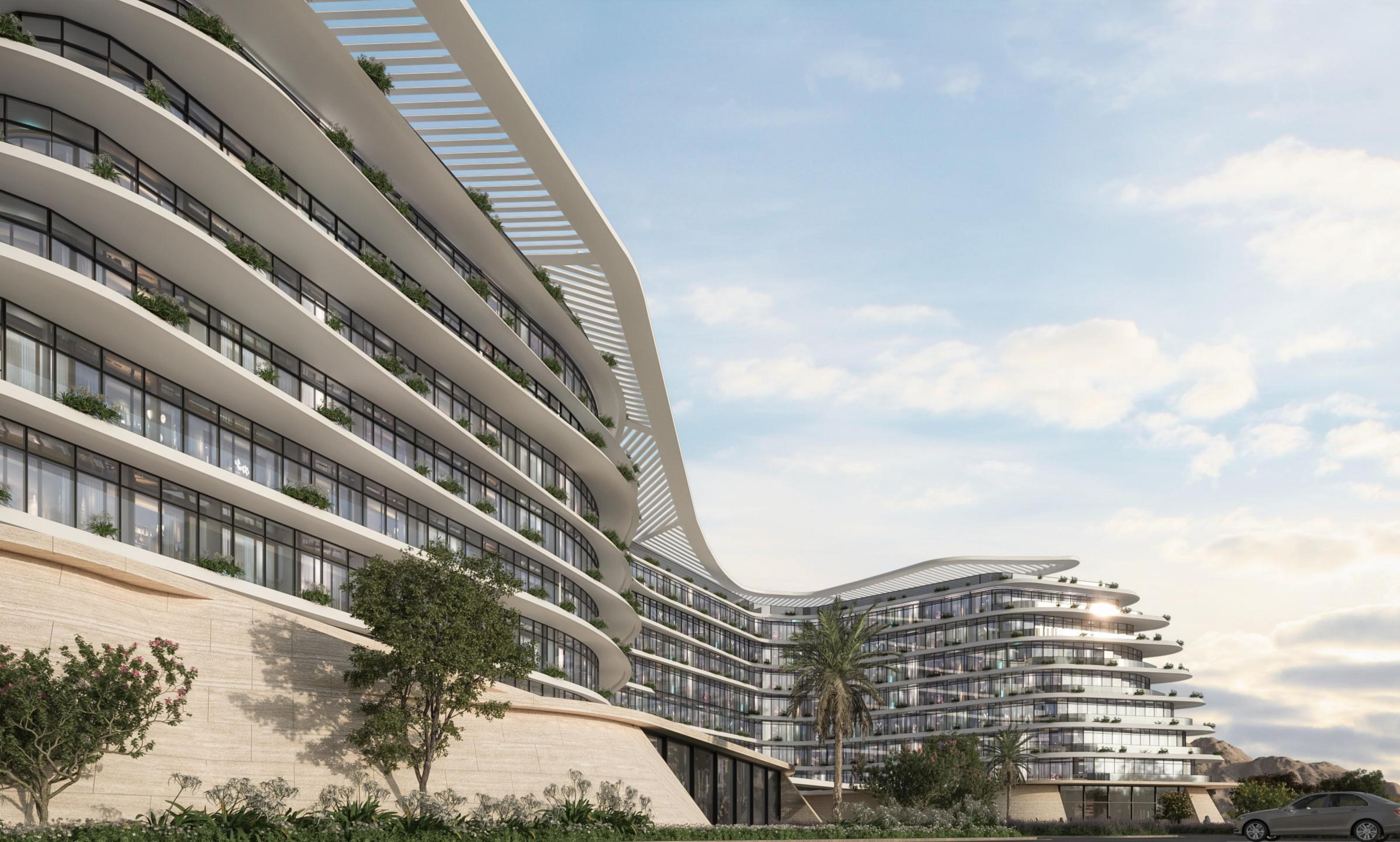
Phase 2 of the programme: 300 hotel keys and 300 serviced apartments with separate entrances, built for the multi-night religious stay. Construction starts in 2027 once the construction permit and Al-Maqr's approval to include the hotel are obtained (6–8 months), on the same 24-month build, opening mid-2029 within the SAR 550M cap. Concept design by Watanco & ZFP; underwritten on IHG's Staybridge Suites projections per key.

Overview › 600-key Hotel
Key revenue drivers

What drives the numbers

600Keys: 300 hotel + 300 serviced apartments
SAR 662Blended ADR 2031 — SAR 850 in the four peak months, SAR 450 off-peak, +2.2% a year
62%Blended occupancy — 85% peak, 50% off-peak (IHG: 57→63%)
SAR 408RevPAR 2031 (IHG projection: SAR 398)
SAR 107MRevenue 2031; rooms 83% of total (IHG)
44 → 47%GOP margin ramp (IHG)
3% + 8% + 4%Operator base fee on revenue, incentive on GOP, FF&E reserve
SAR 35M + 15MFF&E + pre-opening, both from the SAR 50M FF&E & preparation line
Financials on a timeline

Exhibit: Hotel Returns — key assumptions, operations, capex and returns

Download this exhibit as PDF ↗   Excel model ↗

Exhibit: Hotel ReturnsTotalYear 1
2026
Year 2
2027
Year 3
2028
Year 4
2029
Year 5
2030
Year 6
2031
Year 7
2032
Year 8
2033
Year 9
2034
Year 10
2035
Year 11
2036
Year 12
2037
Year 13
2038
Year 14
2039
Year 15
2040
Key assumptions
Keys (300 hotel + 300 serviced apartments)–––600600600600600600600600600600600600
Blended ADR, SAR–––634648662677692707723739755772789806
Blended occupancy–––55.8%58.7%61.7%61.7%61.7%61.7%61.7%61.7%61.7%61.7%61.7%61.7%
RevPAR, SAR–––354380408417427436446455466476486497
Other revenue (F&B, other) as % of rooms revenue–––19.9%19.9%19.9%19.9%19.9%19.9%19.9%19.9%19.9%19.9%19.9%19.9%
GOP margin (IHG benchmark)–––44.2%46.1%47.4%47.4%47.4%47.4%47.4%47.4%47.4%47.4%47.4%47.4%
Operator base fee, % of revenue (plus 8% of GOP incentive and 4% FF&E reserve)–––3.0%3.0%3.0%3.0%3.0%3.0%3.0%3.0%3.0%3.0%3.0%3.0%
Operations
Revenue1,331,613–––46,44099,862107,215109,585112,006114,482117,012119,598122,241124,942127,704130,526
EBITDA | Hotel (after operator fees)484,915–––15,63335,36339,24940,11741,00341,91042,83643,78244,75045,73946,75047,783
Koushan Asset Management Fee––––––––––––––––
Land Lease (revenue share)(26,632)–––(929)(1,997)(2,144)(2,192)(2,240)(2,290)(2,340)(2,392)(2,445)(2,499)(2,554)(2,611)
Land Lease Cost (allocated)––––––––––––––––
SPV overheads (allocated)––––––––––––––––
Component NOI458,283–––14,70533,36637,10537,92538,76339,62040,49541,39042,30543,24044,19645,172
Capex
Structural works48,818–9,76426,85012,205–––––––––––
Finishes45,063–9,01324,78511,266–––––––––––
MEP works26,287–5,25714,4586,572–––––––––––
Landscaping, water features & infrastructure24,447–4,88913,4466,112–––––––––––
Hotel FF&E (net of pre-opening)35,000–7,00019,2508,750–––––––––––
Contingency & project management reserves5,633–1,1273,0981,408–––––––––––
Design, supervision, fees & permits10,515–2,1035,7832,629–––––––––––
Marketing, rent & administration during construction4,506–9012,4781,127–––––––––––
Pre-opening (within the SAR 550M cap)15,000––5,00010,000–––––––––––
Total CapEx215,269–40,054115,14860,068–––––––––––
Net Cash243,014–(40,054)(115,148)(45,363)33,36637,10537,92538,76339,62040,49541,39042,30543,24044,19645,172
Exit Value at exhibit cap (final year, leasehold-adjusted)443,635––––––––––––––443,635
Net Cashflows including TV686,649–(40,054)(115,148)(45,363)33,36637,10537,92538,76339,62040,49541,39042,30543,24044,196488,807
Hotel IRR19.0%

SAR'000 unless stated. Years 1–15 = 2026–2040; exit in Year 15 (2040) at a 10% cap rate adjusted for the leasehold to 2074; before zakat and VAT recovery. Total investment capped at SAR 550M including pre-opening; shared budget items allocated by built-up area; fixed land rent and SPV overheads (which cover the asset-management role — no separate Koushan fee) shared between the Experience Centre and retail in proportion to stabilised 2032 revenue, none to the hotel; hotel is Phase 2 (construction from 2027 after the construction permit and Al-Maqr approval). Source: Mayadeen Park Financing Model v1.0 (22 Oct 2026).

17.4%Component IRR, hold to 2074
19.0%Component IRR, exit 2040 at 10% cap
17.6%Yield on allocated capex, 2032
SAR 215MAllocated capex incl. pre-opening
2035Payback year
Budget

Hard and soft cost within the SAR 550M cap — Hotel column highlighted

SAR millionGMP budgetRetailExperience CentreHotel (Phase 2)Total within capPre-opening offset
Structural works130.048.812.648.8110.2(19.8)
Finishes120.045.111.645.1101.7(18.3)
MEP works70.031.911.926.370.0—
Landscaping, water features & infrastructure65.129.611.024.465.1—
Hotel FF&E (net of pre-opening)50.0——35.035.0(15.0)
Experience Centre content & AV systems60.0—60.0—60.0—
Contingency reserve11.05.01.94.111.0—
Project management reserve4.01.80.71.54.0—
Design15.06.82.55.615.0—
Supervision8.03.61.43.08.0—
Fees & permits5.02.30.81.95.0—
Marketing & pre-opening (within GMP)7.03.21.22.67.0—
Rent & administration during construction5.02.30.81.95.0—
Hard cost (construction)510.1162.2109.6185.2457.1(53.0)
Soft cost40.018.26.815.040.0—
Pre-opening (added within the cap)—19.818.215.053.053.0
TOTAL INVESTMENT550.1200.3134.6215.3550.1—

The contractor's GMP breakdown (510 construction + 40 soft) with all pre-opening absorbed inside the SAR 550M cap: hotel pre-opening (15) comes out of the FF&E & preparation line (FF&E 35); Centre (18.2) and retail (19.8) pre-opening are offset pro-rata against structural works and finishes. Shared items allocated by built-up area; direct items to their component.

Documents & model

Download