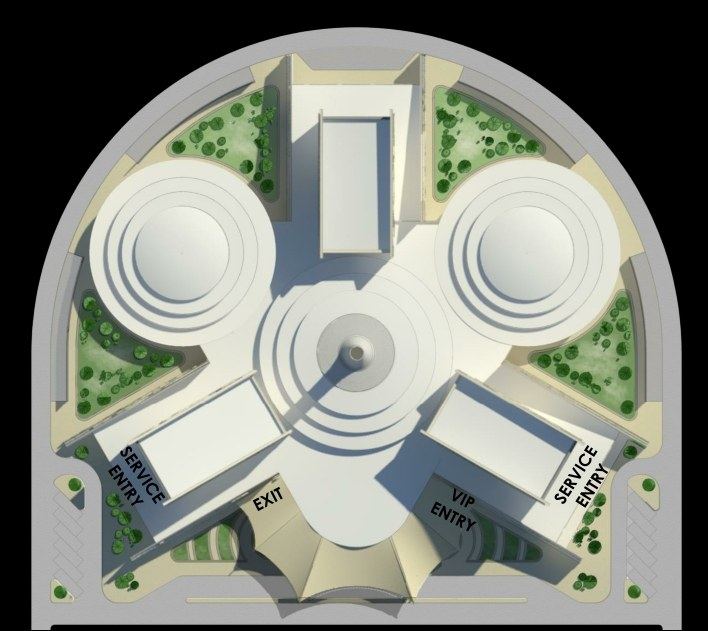
Component 1 of 3 · the anchor

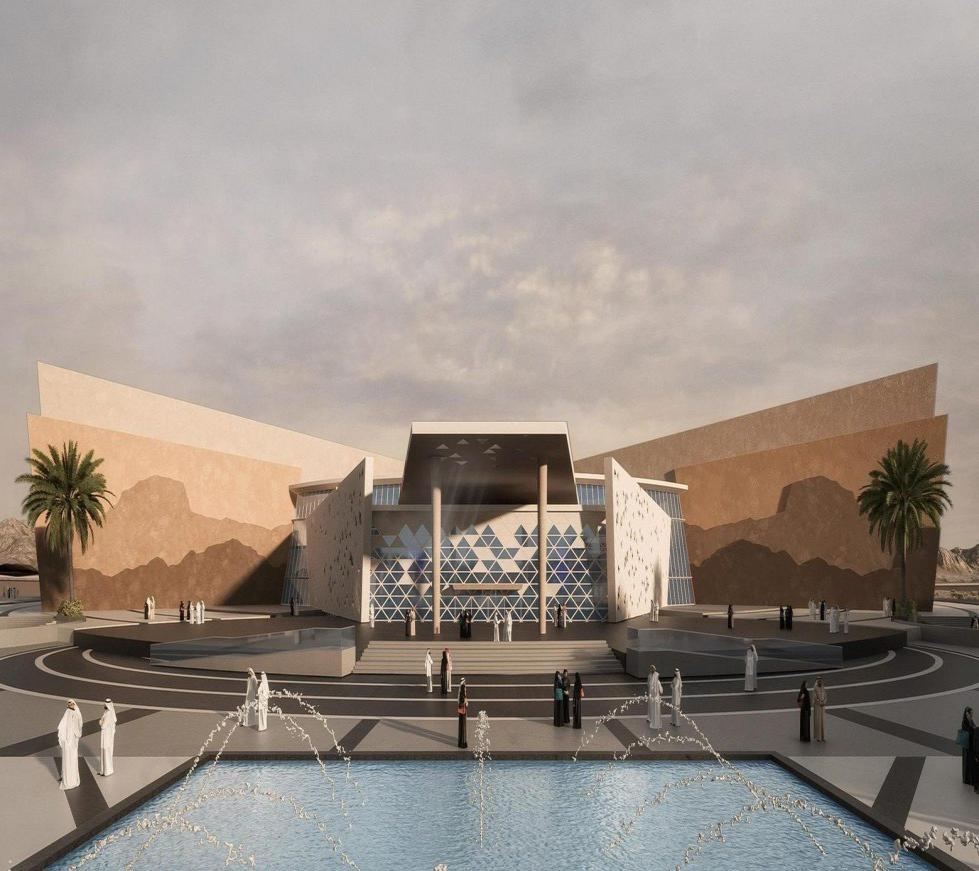
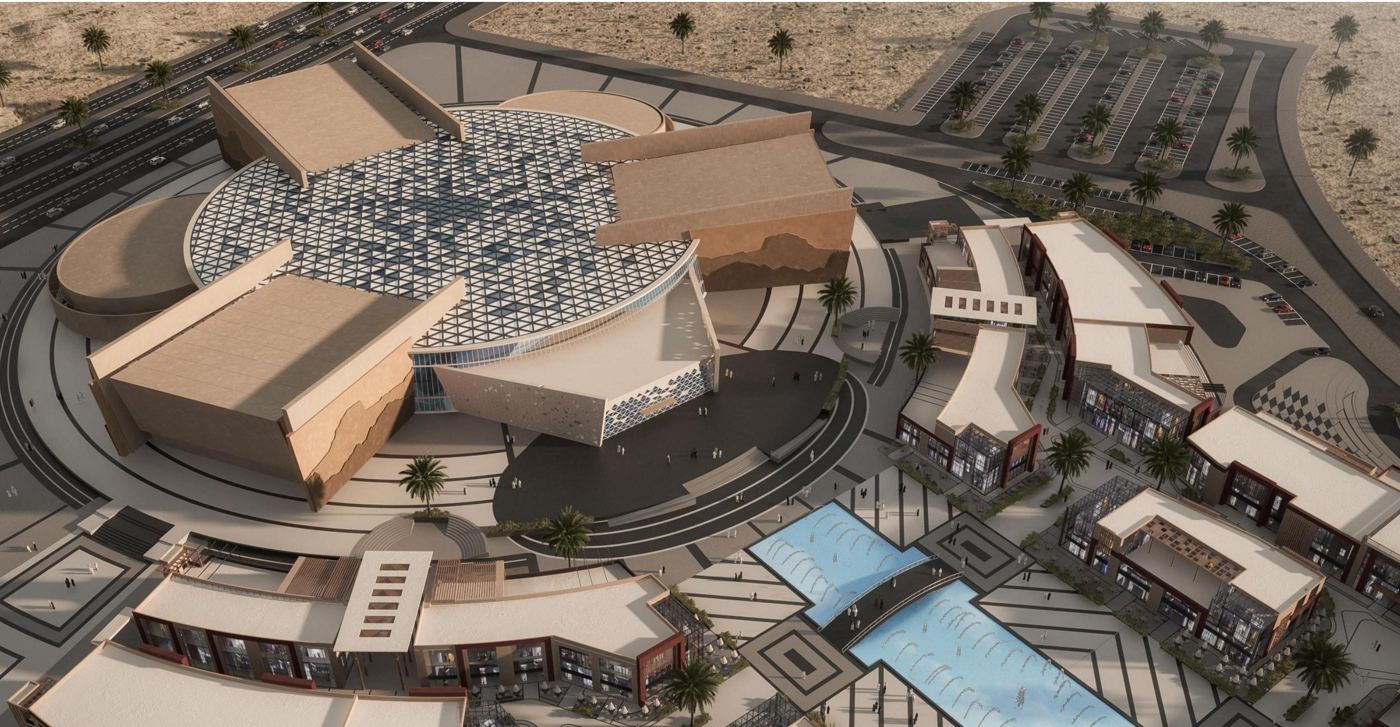
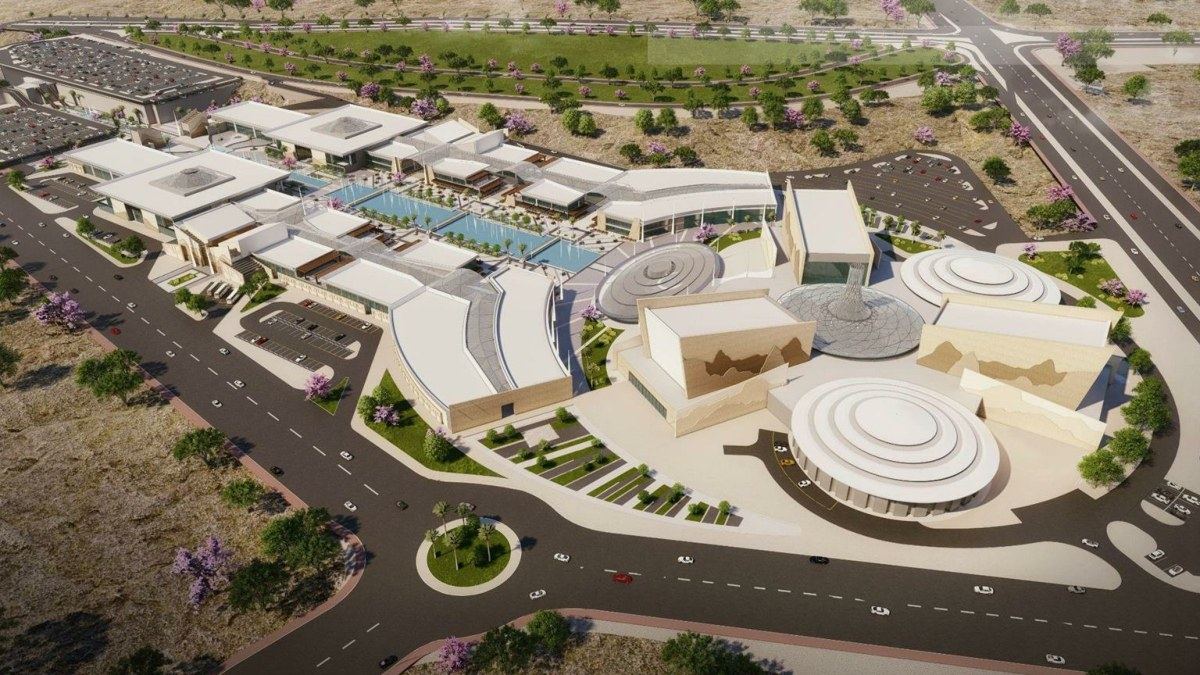
Experience Centre

18,050 sqm of VR, 5D and immersive theatres where visitors relive the Hijra, the 27 Ghazawat and the battles of Badr, Uhud and Al-Khandaq — then stay to dine and shop. Base case: the operator's consolidated pro-forma (ProFun for Midwam, January 2025) on LDP's attendance forecast; LDP's lower-margin case is carried as the downside.

Overview › Experience Centre
Key revenue drivers

What drives the numbers

1,205KVisitors in 2031 (ProFun on LDP attendance; LDP base 1.19M)
SAR 99Revenue per visitor, 2031 — admissions SAR 84 + F&B, retail, photo (ProFun)
35%EBITDA margin after management fees, 2031 (ProFun)
35 → 43%EBITDA margin 2028 → 2040 as labour and non-labour costs fall as a share of revenue
SAR 119MRevenue 2031, growing to SAR 187M by 2040 (ProFun), +2.5% thereafter
24%Free-cash-flow margin at stabilisation (2032)
SAR 60MContent & AV systems within the GMP
SAR 18.2MPre-opening funded by the project (50% of ProFun's 36.4)
Financials on a timeline

Exhibit: Experience Centre Returns — key assumptions, operations, capex and returns

Download this exhibit as PDF ↗   Excel model ↗

Exhibit: Experience Centre ReturnsTotalYear 1
2026
Year 2
2027
Year 3
2028
Year 4
2029
Year 5
2030
Year 6
2031
Year 7
2032
Year 8
2033
Year 9
2034
Year 10
2035
Year 11
2036
Year 12
2037
Year 13
2038
Year 14
2039
Year 15
2040
Key assumptions
Visitors, '000 (full-year equivalent)––1,1351,1631,1831,2051,2451,2851,3321,3821,4171,4511,4811,5151,549
Revenue per visitor, SAR (admissions + F&B + retail + photo)––92959799101103106108110113116118121
Average admission per visitor, SAR (ProFun)––7780828485878991949698100102
Trading factor (opening year 25%)––0.251.001.001.001.001.001.001.001.001.001.001.001.00
EBITDA margin after management fees––27.8%31.6%32.5%32.9%34.1%35.4%36.6%37.9%38.8%39.6%40.4%41.1%41.8%
Operations
Revenue1,776,939––26,082110,519115,216119,075125,825132,794140,706149,264156,540163,825171,073178,880187,140
EBITDA | Experience Centre (after operator fees)663,289––7,25134,92837,41239,21242,96446,94651,53956,58460,79364,93269,02973,47578,224
Koushan Asset Management Fee––––––––––––––––
Land Lease (revenue share)(35,539)––(522)(2,210)(2,304)(2,382)(2,516)(2,656)(2,814)(2,985)(3,131)(3,276)(3,421)(3,578)(3,743)
Land Lease Cost (allocated)(20,779)––(1,222)(1,630)(1,630)(1,630)(1,630)(1,630)(1,630)(1,630)(1,630)(1,630)(1,630)(1,630)(1,630)
SPV overheads (allocated)(114,825)––(3,922)(8,039)(8,240)(8,446)(8,657)(8,874)(9,096)(9,323)(9,556)(9,795)(10,040)(10,291)(10,548)
Component NOI492,146––1,58623,04925,23826,75530,16133,78737,99942,64646,47750,23153,93857,97762,304
Capex
Structural works12,5652,9009,666–––––––––––––
Finishes11,599–6,3895,210––––––––––––
MEP works11,862–7,4904,372––––––––––––
Landscaping, water features & infrastructure11,0324585,3555,219––––––––––––
Experience Centre content & AV systems60,000–21,80038,200––––––––––––
Contingency & project management reserves2,5423561,593593––––––––––––
Design, supervision, fees & permits4,7452,9991,356390––––––––––––
Marketing, rent & administration during construction2,0331535081,373––––––––––––
Pre-opening (within the SAR 550M cap)18,200–2,47515,725––––––––––––
Total CapEx134,5786,86556,63271,081––––––––––––
Net Cash357,568(6,865)(56,632)(69,496)23,04925,23826,75530,16133,78737,99942,64646,47750,23153,93857,97762,304
Exit Value at exhibit cap (final year, leasehold-adjusted)614,008––––––––––––––614,008
Net Cashflows including TV971,576(6,865)(56,632)(69,496)23,04925,23826,75530,16133,78737,99942,64646,47750,23153,93857,977676,311
Experience Centre IRR26.2%

SAR'000 unless stated. Years 1–15 = 2026–2040; exit in Year 15 (2040) at a 10% cap rate adjusted for the leasehold to 2074; before zakat and VAT recovery. Total investment capped at SAR 550M including pre-opening; shared budget items allocated by built-up area; fixed land rent and SPV overheads (which cover the asset-management role — no separate Koushan fee) shared between the Experience Centre and retail in proportion to stabilised 2032 revenue, none to the hotel; hotel is Phase 2 (construction from 2027 after the construction permit and Al-Maqr approval). Source: Mayadeen Park Financing Model v1.0 (22 Oct 2026).

23.7%Component IRR, hold to 2074
26.2%Component IRR, exit 2040 at 10% cap
22.4%Yield on allocated capex, 2032
SAR 135MAllocated capex incl. pre-opening
2033Payback year
Budget

Hard and soft cost within the SAR 550M cap — Experience Centre column highlighted

SAR millionGMP budgetRetailExperience CentreHotel (Phase 2)Total within capPre-opening offset
Structural works130.048.812.648.8110.2(19.8)
Finishes120.045.111.645.1101.7(18.3)
MEP works70.031.911.926.370.0—
Landscaping, water features & infrastructure65.129.611.024.465.1—
Hotel FF&E (net of pre-opening)50.0——35.035.0(15.0)
Experience Centre content & AV systems60.0—60.0—60.0—
Contingency reserve11.05.01.94.111.0—
Project management reserve4.01.80.71.54.0—
Design15.06.82.55.615.0—
Supervision8.03.61.43.08.0—
Fees & permits5.02.30.81.95.0—
Marketing & pre-opening (within GMP)7.03.21.22.67.0—
Rent & administration during construction5.02.30.81.95.0—
Hard cost (construction)510.1162.2109.6185.2457.1(53.0)
Soft cost40.018.26.815.040.0—
Pre-opening (added within the cap)—19.818.215.053.053.0
TOTAL INVESTMENT550.1200.3134.6215.3550.1—

The contractor's GMP breakdown (510 construction + 40 soft) with all pre-opening absorbed inside the SAR 550M cap: hotel pre-opening (15) comes out of the FF&E & preparation line (FF&E 35); Centre (18.2) and retail (19.8) pre-opening are offset pro-rata against structural works and finishes. Shared items allocated by built-up area; direct items to their component.

ProFun consolidated financial projections (business plan p.59)

ProFun consolidated pro-forma, SAR M2028202920302031203220332034203520362037203820392040
Revenue per visitor (SAR)92959799101103106108110113116118121
Implied visitors ('000)1,1351,1631,1831,2051,2451,2851,3321,3821,4171,4511,4811,5151,549
Total revenue (ex-VAT)104.3110.5115.2119.1125.8132.8140.7149.3156.5163.8171.1178.9187.1
Cost of sales(9.6)(10.1)(10.5)(10.9)(11.5)(12.2)(12.9)(13.6)(14.3)(14.9)(15.6)(16.3)(17.0)
Operating expenses (labour + non-labour)(52.6)(58.2)(59.6)(61.0)(62.9)(64.8)(66.8)(68.9)(70.8)(72.7)(74.7)(76.8)(78.9)
Gross operating profit42.142.245.047.151.455.961.066.771.576.280.885.891.2
Management fees (Midwam)(5.1)(5.2)(5.5)(5.7)(6.2)(6.6)(7.2)(7.8)(8.3)(8.7)(9.2)(9.7)(10.3)
EBITDA37.037.039.541.445.249.253.959.063.267.471.676.180.9
EBITDA margin35.5%33.5%34.3%34.7%35.9%37.1%38.3%39.5%40.4%41.2%41.8%42.5%43.2%

Source: ProFun Pro Forma Business Plan Rev.1, 18 January 2025, "Consolidated financial performance projections". Full-year figures; the model applies a 25% trading factor to the Q4 2028 opening year and deducts a SAR 2M (inflated) annual content-refresh reserve.

Documents & model

Download